Debugging C++ Release Projects - Finding the Lost Object Information
2014-02-17 12:12
411 查看
Debugging C++ Release Projects - Finding the Lost Object Information
By YochaiTimmer, 15 Feb 2014
|
|
Introduction
When compiling a C++ project in release with optimizations, the compiler sometimes doesn't show the right object information.The local variables are usually the first to go, and many times the
thisobject's information are lost to the debugger.
The reason is that the compiler uses the available hardware registers to hold the information, and uses optimizations to avoid allocation of local variables.
In this tip, I'll show how to use Visual Studio's tools to see where the information is held.
Using the Code
I'll give a simple example of some code that throws an exception,I'll create a simple class and a situation where one of the member's value will cause a division by zero exception.
I'll add an extra method just so the debugger will stop at the right line (due to optimizations, the debugger may not stop at the right line, because the actual code stack doesn't represent where you are in the code - just the return address. This issue
may be explained in a future post.).
The extra method is important for this scenario, just so we can imitate the scenario I'm talking about.

Collapse | Copy
Code
class SomeClass
{
public:
int a,b;
void MyMethod()
{
int i = 0;
int j = i;
DoStuff();
a = this->a/this->b;
DoStuff();
DoStuff();
}

void DoStuff()
{
int i = 10;
int j = 5;
int k = 4;
for ( ;i * j + k < 40000; i++)
{
int fs = 34;
}
printf("%d %d %d %d %d", i , j , k , 10,8);
}
};
int main(int argc, void* argv[])
{
SomeClass a;
a.a = 5;
a.b = 0;

a.MyMethod();
return 0;
}
Now, if you run this little program in release mode, you'll get an exception complaining about a division by zero. This is because the member
bis
set to
0.
The debugger will conveniently stop at the right line, but unfortunately all the local variables and the
thisvariable
will be corrupted.
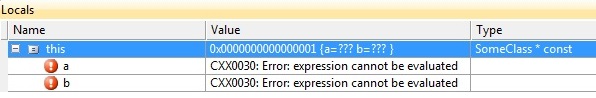
The information is obviously somewhere, but the debugger just doesn't seem to load the right information. If you look closely, then you can see that the
thisvalue
is
01which indicates that it's just reading the
object's information from the wrong place/address.
So, how can we find the object's right address ?
Using the Call Stack
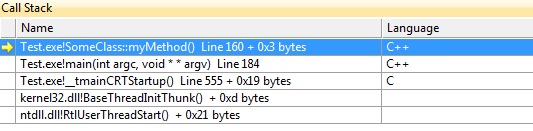
The first method, which is the easiest, is to go up the call stack and hope that at some level the debugger sees the right address. This is by far easier than the next method...If we look at the call stack, we can see that the debugger correctly resolved that we are in the method
MyMethodof
the
SomeClassclass:
So, if we just go to the previous function in the stack (
main), the debugger might still hold the right address
to the object (because the object was known and used there). This will work as long as the compiler didn't decide to re-use the registers that held the object's address.
So, if we double click the line just below our current position, the debugger will jump to the code where the current method was called:


Here, we can clearly see that
bequals
0,
and we are dividing by
b, so mystery solved - that's why we get an exception!
But... In deeper nested call stacks, with more complicated code, this doesn't always work, and the debugger may use the information throughout the whole call stack hierarchy.
Registry Values and Disassembly
The key is to understand that the CPU holds its information in its registers. Although the actual information may be stored in memory (stack or heap), the CPU itself only uses the registers.The compiler adds assembly code that copies the relevant information from the memory to the registers for the CPU to actually do the calculations.
Knowing that, we can assume that most of the locally used variables and
thisaddress will be held in the registers
(unless there is no farther use for them, in which case the register may be re-used to hold other information).
To know how exactly the variables are mapped to registers, we can use the Disassembly window and Registerswindow.
I'll not really go into assembly code, I'll just look at the register names.
Let's look at the Dissasembly window of our problematic code. We want to find a place where the code calls a local variable of the current object we want, the mapped assembly code can point out the
register it's using:

We can see that when we call the local members, the matching assembly code calls a register called
rdi.
This register probably holds the address of our object (object members are accessed by an offset from the object's starting point (address) in memory).
We will now want to see what value the register holds. We hope that it's an address (a large number). If we open the Registers window, we can see its value:

We can see that
rdiholds the value
000000000025F950it's
a hexadecimal value that is pretty big, and this is what a memory address usually looks like. (Lower values usually represent counters or other local function members.)
Of course, this means absolutely nothing to me, or almost anyone else, so let's let the debugger help us figure it out.
We can now open the Watch window. It's a useful window which among other things allows you to enter specific addresses and show their value.
We'll cast the address to a pointer of our object's type, and add a
0xprefix to the number so the debugger knows
it's a hexadecimal value:
Collapse | Copy
Code
(SomeClass*)(0x000000000025F950)
The debugger will now show us the object like we're used to seeing it:

Points of Interest
Call Stack: Debug -> Windows -> Call Stack (alt+7)Locals: Debug -> Windows -> Locals (alt+4)
Disassembly window: Debug -> Windows -> Disassembly (alt+8)
Registers window: Debug -> Windows -> Registers (alt+5)
Watch window: Debug -> Windows -> Watch -> Watch 1 (ctrl + alt + w, 1)
History
15th February, 2014: Initial version
License
This article, along with any associated source code and files, is licensed under The CodeProject Open License (CPOL)

相关文章推荐
- VS2010 & Qt,版本Release时:Debugging information for "project.exe" cannot be found or does not match.
- C++随记:Debugging information for "Project.exe" cannot be found or does not match.
- Inside the C++ Object Model学习笔记[Chap2.4]
- CRT Debugging Techniques / Finding Memory Leaks Using the CRT Library
- Inside the C++ Object Model学习笔记[Chap5]
- Error:Debugging information for "project.exe" cannot be found or does not match. Binary was not ……
- Inside The C++ Object Model(Note):sizeof in an object
- Carbide.C++ import工程时 失败:overlaps the location of another project
- Unable to start debugging on the web server. The project is not configured to be debugged.
- C++对象模型《Inside the C++ Object Model》
- Error while trying to run project:unable to start debugging.the debugger is not properly installed. run setup to install or repa
- Inside the C++ Object Model学习笔记[Chap3.0]
- Inside The C++ Object Model(四)
- c++ what happens when a constructor throws an exception and leaves the object in an inconsistent state?
- Inside the C++ Object Model学习笔记[Chap6]
- Error: debugging information for project.exe' cannot be found or does not match. No symbols loade
- Inside the C++ Object Model 学习笔记 第六章 执行期语义学
- SoapUI Pro Project Solution Collection-access the soapui object
- The project was not built since its build path is incomplete. Cannot find the class file for java.lang.Object
- Inside the C++ Object Model 深度探索对象模型 5-7