C++内存泄露检测
2013-10-23 11:02
344 查看
一
Visual Studio 调试器和 C 运行时 (CRT) 库为我们提供了检测和识别内存泄漏的有效方法。主要使用函数:_CrtDumpMemoryLeaks();
二 实例

#define _CRTDBG_MAP_ALLOC //输出更详细的report
#include <stdlib.h>
#include <crtdbg.h>
//以上的内容必须放在其他include的前面
#include <vector>
class MyClass

{

private:
int *p;
public:
MyClass()

{
if(p != NULL)
{
p = new int(0);

}
}
~MyClass()
{
if(p != NULL)
{
delete p;
p = NULL;
}
}

};
int _tmain(int argc, _TCHAR* argv[])
{
int *i = NULL; // better for read
i = new int(0);
int *&y = i; // pointer's reference
MyClass *pMyClass = new MyClass();
std::vector<MyClass*> myClasses;
myClasses.push_back(new MyClass());
myClasses.push_back(new MyClass());
_CrtDumpMemoryLeaks();
return 0;
}
三说明
1)只对debug模有用,可以在程序运行后在vs的ide的output的最后看到泄露的检测结果。
2)可以检测系统类型,自定义类型和stl 容器。
3)#define _CRTDBG_MAP_ALLOC //包含该宏定义输出更详细的report
#include <stdlib.h>
#include <crtdbg.h>
//以上的内容必须放在其他include的前面,否则可能使上面定义的宏失效。
4)如果程序有统一的退出口,则在退出时调用_CrtDumpMemoryLeaks();
5)如果程序有多个出口,则可以在程序开始处包含下面的调用:_CrtSetDbgFlag ( _CRTDBG_ALLOC_MEM_DF | _CRTDBG_LEAK_CHECK_DF );这条语句无论程序在什么地方退出都会自动调用 _CrtDumpMemoryLeaks。
使用MFC提供的功能来检测内存泄露。
使用方法:
1)工程是MFC工程,或是工程的设置中有Use MFC in a Shared DLL,
2)很多地方说是要定义以下宏
#ifdef _DEBUG
#define new DEBUG_NEW
#endif
但是我发现只要include <afx.h> 即可。(大家可以检测一下)
3)可以在F5运行程序后,在output窗口中看到如下的内存泄露的显示。(只在debug下有用哦)
4)如果有泄露,则显示如下:
Detected memory leaks!
Dumping objects ->
{214} normal block at 0x00D91618, 4 bytes long.
Data: < > 00 00 00 00
{208} normal block at 0x00D914D0, 4 bytes long.
Data: < > 00 00 00 00
{207} normal block at 0x00D91490, 4 bytes long.
Data: < > D0 14 D9 00
{205} normal block at 0x00D91410, 4 bytes long.
Data: < > 00 00 00 00
{204} normal block at 0x003AFFD8, 4 bytes long.
Data: < > 10 14 D9 00
{203} normal block at 0x003AFF98, 4 bytes long.
Data: < > 00 00 00 00
{202} normal block at 0x003AFF58, 4 bytes long.
Data: < : > 98 FF 3A 00
{200} normal block at 0x003AFF18, 4 bytes long.
Data: < > 00 00 00 00
Object dump complete.
一 简单的对内存的分配和释放跟踪,并将结果输出到console,它也是一般C++内存泄露的检测原理,来自C++编程思想:
(比较简单,大家都可以看的明白的哦)实现如下:
MemCheck.h
//: C02:MemCheck.h
#ifndef MEMCHECK_H
#define MEMCHECK_H
#include <cstddef> // for size_t
// Hijack the new operator (both scalar and array versions)
void* operator new(std::size_t, const char*, long);
void* operator new[](std::size_t, const char*, long);
#define new new (__FILE__, __LINE__)
extern bool traceFlag;
#define TRACE_ON() traceFlag = true
#define TRACE_OFF() traceFlag = false
extern bool activeFlag;
#define MEM_ON() activeFlag = true
#define MEM_OFF() activeFlag = false
#endif
///:~
MemCheck.cpp
//: C02:MemCheck.cpp {O}
#include <cstdio>
#include <cstdlib>
#include <cassert>
using namespace std;
#undef new
// Global flags set by macros in MemCheck.h
bool traceFlag = true;
bool activeFlag = false;
namespace {
// Memory map entry type
struct Info {
void* ptr;
const char* file;
long line;
};
// Memory map data
const size_t MAXPTRS = 10000u;
Info memMap[MAXPTRS];
size_t nptrs = 0;
// Searches the map for an address
int findPtr(void* p)
{
for (int i = 0; i < nptrs; ++i)
if (memMap[i].ptr == p)
return i;
return -1;
}
void delPtr(void* p)
{
int pos = findPtr(p);
assert(p >= 0);
// Remove pointer from map
for (size_t i = pos; i < nptrs-1; ++i)
memMap[i] = memMap[i+1];
--nptrs;
}
// Dummy type for static destructor
struct Sentinel
{
~Sentinel()
{
if (nptrs > 0)
{
printf("Leaked memory at:\n");
for (size_t i = 0; i < nptrs; ++i)
printf("\t%p (file: %s, line %ld)\n",
memMap[i].ptr, memMap[i].file, memMap[i].line);
}
else
printf("No user memory leaks!\n");
}
};
// Static dummy object
Sentinel s;
} // End anonymous namespace
// Overload scalar new
void* operator new(size_t siz, const char* file,
long line) {
void* p = malloc(siz);
if (activeFlag)
{
if (nptrs == MAXPTRS)
{
printf("memory map too small (increase MAXPTRS)\n");
exit(1);
}
memMap[nptrs].ptr = p;
memMap[nptrs].file = file;
memMap[nptrs].line = line;
++nptrs;
}
if (traceFlag)
{
printf("Allocated %u bytes at address %p ", siz, p);
printf("(file: %s, line: %ld)\n", file, line);
}
return p;
}
// Overload array new
void* operator new[](size_t siz, const char* file,
long line) {
return operator new(siz, file, line);
}
// Override scalar delete
void operator delete(void* p)
{
if (findPtr(p) >= 0)
{
free(p);
assert(nptrs > 0);
delPtr(p);
if (traceFlag)
printf("Deleted memory at address %p\n", p);
}
else if (!p && activeFlag)
printf("Attempt to delete unknown pointer: %p\n", p);
}
// Override array delete
void operator delete[](void* p) {
operator delete(p);
} ///:~
二 说明:
1)通过重载new和delete来实现
2)使用时需要在工程中加入MemCheck.h和MemCheck.cpp,在需要检测的文件的前面include “MemCheck.h”,但是必须在所有的include的最后。
3)MEM_ON(),MEM_OFF()用来打开或关闭检测
4)TRACE_ON(),和TRACE_OFF()用来打开或关闭检测结果的输出
5)可以检测代码中使用了流,标准容器,以及某个类的构造函数分配了空间
三 使用实例:
console 的project中加入下面的file:
// MemoryLeak3.cpp : Defines the entry point for the console application.
//
#include <iostream>
#include <vector>
#include <cstring>
#include "MemCheck.h" // Must appear last!
using namespace std;
void Test()
{
int *i = new int(0);
}
class MyClass
{
private:
int *p;
public:
MyClass()
{
if(p != NULL)
{
p = new int(0);
}
}
~MyClass()
{
if(p != NULL)
{
delete p;
p = NULL;
}
}
};
void Test2()
{
int *i = NULL; // better for read
i = new int(0);
int *&y = i; // pointer's reference
delete i;
MyClass *pMyClass = new MyClass();
std::vector<MyClass*> myClasses;
myClasses.push_back(new MyClass());
myClasses.push_back(new MyClass());
std::vector<void*> myVector;
myVector.push_back(new MyClass());
myVector.push_back(new MyClass());
delete (MyClass *)(myVector.at(0));
delete myVector.at(1); // memory leak
}
class Foo
{
char* s;
public:
Foo(const char*s )
{
this->s = new char[strlen(s) + 1];
strcpy(this->s, s);
}
~Foo()
{
delete [] s;
}
};
void Test3()
{
cout << "hello\n";
int* p = new int;
delete p;
int* q = new int[3];
delete [] q;
int* r;
/*delete r;*/
vector<int> v;
v.push_back(1);
Foo s("goodbye");
}
int main()
{
TRACE_OFF();
MEM_ON();
Test();
Test2();
Test3();
MEM_OFF();
} ///:~
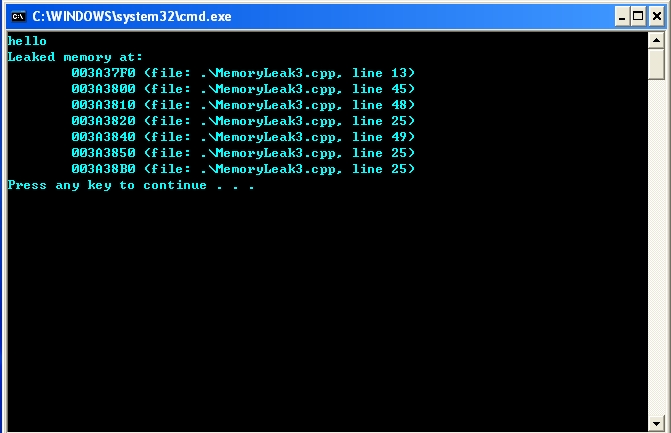
四 测试结果如下:
一 使用各种工具,一般都是收费的,但是可以申请试用。
二 工具收集
1)BoundsChecker :(http://www.compuware.com/)(首选BoundsChecker)
应该说是功能最强,使用只需要open需要测试的exe,然后start就可以了,可以通过检测结果定位到源代码中有内存泄露的代码行。
2)Purifyplus (http://www.ibm.com)
3)Memory Validator(http://www.softwareverify.com/index.html)
应该说是功能也比较强,使用只需要start application wizard的start exe就可以了,可以通过检测结果定位到源代码中有内存泄露的代码行。
4)其实以上工具还可以进行其他的各种检测,提高代码的健壮性!
三
工具只能帮助我们更好的发现泄露,但是并不能解决所有的问题,比如说我们的项目非常的复杂或是使用了多个第三方的lib,这样的话,有可能使用以上的工具就检测不到。
丰富的编程经验和良好的编程习惯才能够彻底的杜绝内存的泄露。
Visual Studio 调试器和 C 运行时 (CRT) 库为我们提供了检测和识别内存泄漏的有效方法。主要使用函数:_CrtDumpMemoryLeaks();
二 实例
#define _CRTDBG_MAP_ALLOC //输出更详细的report
#include <stdlib.h>
#include <crtdbg.h>
//以上的内容必须放在其他include的前面
#include <vector>
class MyClass
{
private:
int *p;
public:
MyClass()
{
if(p != NULL)
{
p = new int(0);
}
}
~MyClass()
{
if(p != NULL)
{
delete p;
p = NULL;
}
}
};
int _tmain(int argc, _TCHAR* argv[])
{
int *i = NULL; // better for read
i = new int(0);
int *&y = i; // pointer's reference
MyClass *pMyClass = new MyClass();
std::vector<MyClass*> myClasses;
myClasses.push_back(new MyClass());
myClasses.push_back(new MyClass());
_CrtDumpMemoryLeaks();
return 0;
}
三说明
1)只对debug模有用,可以在程序运行后在vs的ide的output的最后看到泄露的检测结果。
2)可以检测系统类型,自定义类型和stl 容器。
3)#define _CRTDBG_MAP_ALLOC //包含该宏定义输出更详细的report
#include <stdlib.h>
#include <crtdbg.h>
//以上的内容必须放在其他include的前面,否则可能使上面定义的宏失效。
4)如果程序有统一的退出口,则在退出时调用_CrtDumpMemoryLeaks();
5)如果程序有多个出口,则可以在程序开始处包含下面的调用:_CrtSetDbgFlag ( _CRTDBG_ALLOC_MEM_DF | _CRTDBG_LEAK_CHECK_DF );这条语句无论程序在什么地方退出都会自动调用 _CrtDumpMemoryLeaks。
使用MFC提供的功能来检测内存泄露。
使用方法:
1)工程是MFC工程,或是工程的设置中有Use MFC in a Shared DLL,
2)很多地方说是要定义以下宏
#ifdef _DEBUG
#define new DEBUG_NEW
#endif
但是我发现只要include <afx.h> 即可。(大家可以检测一下)
3)可以在F5运行程序后,在output窗口中看到如下的内存泄露的显示。(只在debug下有用哦)
4)如果有泄露,则显示如下:
Detected memory leaks!
Dumping objects ->
{214} normal block at 0x00D91618, 4 bytes long.
Data: < > 00 00 00 00
{208} normal block at 0x00D914D0, 4 bytes long.
Data: < > 00 00 00 00
{207} normal block at 0x00D91490, 4 bytes long.
Data: < > D0 14 D9 00
{205} normal block at 0x00D91410, 4 bytes long.
Data: < > 00 00 00 00
{204} normal block at 0x003AFFD8, 4 bytes long.
Data: < > 10 14 D9 00
{203} normal block at 0x003AFF98, 4 bytes long.
Data: < > 00 00 00 00
{202} normal block at 0x003AFF58, 4 bytes long.
Data: < : > 98 FF 3A 00
{200} normal block at 0x003AFF18, 4 bytes long.
Data: < > 00 00 00 00
Object dump complete.
一 简单的对内存的分配和释放跟踪,并将结果输出到console,它也是一般C++内存泄露的检测原理,来自C++编程思想:
(比较简单,大家都可以看的明白的哦)实现如下:
MemCheck.h
//: C02:MemCheck.h
#ifndef MEMCHECK_H
#define MEMCHECK_H
#include <cstddef> // for size_t
// Hijack the new operator (both scalar and array versions)
void* operator new(std::size_t, const char*, long);
void* operator new[](std::size_t, const char*, long);
#define new new (__FILE__, __LINE__)
extern bool traceFlag;
#define TRACE_ON() traceFlag = true
#define TRACE_OFF() traceFlag = false
extern bool activeFlag;
#define MEM_ON() activeFlag = true
#define MEM_OFF() activeFlag = false
#endif
///:~
MemCheck.cpp
//: C02:MemCheck.cpp {O}
#include <cstdio>
#include <cstdlib>
#include <cassert>
using namespace std;
#undef new
// Global flags set by macros in MemCheck.h
bool traceFlag = true;
bool activeFlag = false;
namespace {
// Memory map entry type
struct Info {
void* ptr;
const char* file;
long line;
};
// Memory map data
const size_t MAXPTRS = 10000u;
Info memMap[MAXPTRS];
size_t nptrs = 0;
// Searches the map for an address
int findPtr(void* p)
{
for (int i = 0; i < nptrs; ++i)
if (memMap[i].ptr == p)
return i;
return -1;
}
void delPtr(void* p)
{
int pos = findPtr(p);
assert(p >= 0);
// Remove pointer from map
for (size_t i = pos; i < nptrs-1; ++i)
memMap[i] = memMap[i+1];
--nptrs;
}
// Dummy type for static destructor
struct Sentinel
{
~Sentinel()
{
if (nptrs > 0)
{
printf("Leaked memory at:\n");
for (size_t i = 0; i < nptrs; ++i)
printf("\t%p (file: %s, line %ld)\n",
memMap[i].ptr, memMap[i].file, memMap[i].line);
}
else
printf("No user memory leaks!\n");
}
};
// Static dummy object
Sentinel s;
} // End anonymous namespace
// Overload scalar new
void* operator new(size_t siz, const char* file,
long line) {
void* p = malloc(siz);
if (activeFlag)
{
if (nptrs == MAXPTRS)
{
printf("memory map too small (increase MAXPTRS)\n");
exit(1);
}
memMap[nptrs].ptr = p;
memMap[nptrs].file = file;
memMap[nptrs].line = line;
++nptrs;
}
if (traceFlag)
{
printf("Allocated %u bytes at address %p ", siz, p);
printf("(file: %s, line: %ld)\n", file, line);
}
return p;
}
// Overload array new
void* operator new[](size_t siz, const char* file,
long line) {
return operator new(siz, file, line);
}
// Override scalar delete
void operator delete(void* p)
{
if (findPtr(p) >= 0)
{
free(p);
assert(nptrs > 0);
delPtr(p);
if (traceFlag)
printf("Deleted memory at address %p\n", p);
}
else if (!p && activeFlag)
printf("Attempt to delete unknown pointer: %p\n", p);
}
// Override array delete
void operator delete[](void* p) {
operator delete(p);
} ///:~
二 说明:
1)通过重载new和delete来实现
2)使用时需要在工程中加入MemCheck.h和MemCheck.cpp,在需要检测的文件的前面include “MemCheck.h”,但是必须在所有的include的最后。
3)MEM_ON(),MEM_OFF()用来打开或关闭检测
4)TRACE_ON(),和TRACE_OFF()用来打开或关闭检测结果的输出
5)可以检测代码中使用了流,标准容器,以及某个类的构造函数分配了空间
三 使用实例:
console 的project中加入下面的file:
// MemoryLeak3.cpp : Defines the entry point for the console application.
//
#include <iostream>
#include <vector>
#include <cstring>
#include "MemCheck.h" // Must appear last!
using namespace std;
void Test()
{
int *i = new int(0);
}
class MyClass
{
private:
int *p;
public:
MyClass()
{
if(p != NULL)
{
p = new int(0);
}
}
~MyClass()
{
if(p != NULL)
{
delete p;
p = NULL;
}
}
};
void Test2()
{
int *i = NULL; // better for read
i = new int(0);
int *&y = i; // pointer's reference
delete i;
MyClass *pMyClass = new MyClass();
std::vector<MyClass*> myClasses;
myClasses.push_back(new MyClass());
myClasses.push_back(new MyClass());
std::vector<void*> myVector;
myVector.push_back(new MyClass());
myVector.push_back(new MyClass());
delete (MyClass *)(myVector.at(0));
delete myVector.at(1); // memory leak
}
class Foo
{
char* s;
public:
Foo(const char*s )
{
this->s = new char[strlen(s) + 1];
strcpy(this->s, s);
}
~Foo()
{
delete [] s;
}
};
void Test3()
{
cout << "hello\n";
int* p = new int;
delete p;
int* q = new int[3];
delete [] q;
int* r;
/*delete r;*/
vector<int> v;
v.push_back(1);
Foo s("goodbye");
}
int main()
{
TRACE_OFF();
MEM_ON();
Test();
Test2();
Test3();
MEM_OFF();
} ///:~
四 测试结果如下:
一 使用各种工具,一般都是收费的,但是可以申请试用。
二 工具收集
1)BoundsChecker :(http://www.compuware.com/)(首选BoundsChecker)
应该说是功能最强,使用只需要open需要测试的exe,然后start就可以了,可以通过检测结果定位到源代码中有内存泄露的代码行。
2)Purifyplus (http://www.ibm.com)
3)Memory Validator(http://www.softwareverify.com/index.html)
应该说是功能也比较强,使用只需要start application wizard的start exe就可以了,可以通过检测结果定位到源代码中有内存泄露的代码行。
4)其实以上工具还可以进行其他的各种检测,提高代码的健壮性!
三
工具只能帮助我们更好的发现泄露,但是并不能解决所有的问题,比如说我们的项目非常的复杂或是使用了多个第三方的lib,这样的话,有可能使用以上的工具就检测不到。
丰富的编程经验和良好的编程习惯才能够彻底的杜绝内存的泄露。

相关文章推荐
- Valgrind 检测linux上c++内存泄露
- C++下面的内存泄露检测
- C++内存泄露检测
- C++内存泄露检测原理
- 检测c/c++中内存泄露
- win32 c++控制台应用程序内存泄露检测
- 【转】c++内存泄露检测,长文慎入!
- vs c++内存泄露检测【模板】
- C++程序内存泄露检测工具
- 【C++】内存泄露检测
- C++内存泄露的检测(一)
- C++内存泄露的检测(一)
- 使用Visual Leak Detector for Visual C++ 捕捉内存泄露---Visual C++内存泄露检测—VLD工具使用说明
- C++内存泄露的检测(二)
- C++内存泄露的检测(二)
- C++内存泄露检测(Visual studio 2010)
- C++内存泄露的检测(三)
- C++内存泄露的检测(三)
- C++ 内存泄露检测方法
- C++内存泄露的检测(四)