HTML5 Canvas的一个有趣实例
2013-10-05 23:36
288 查看
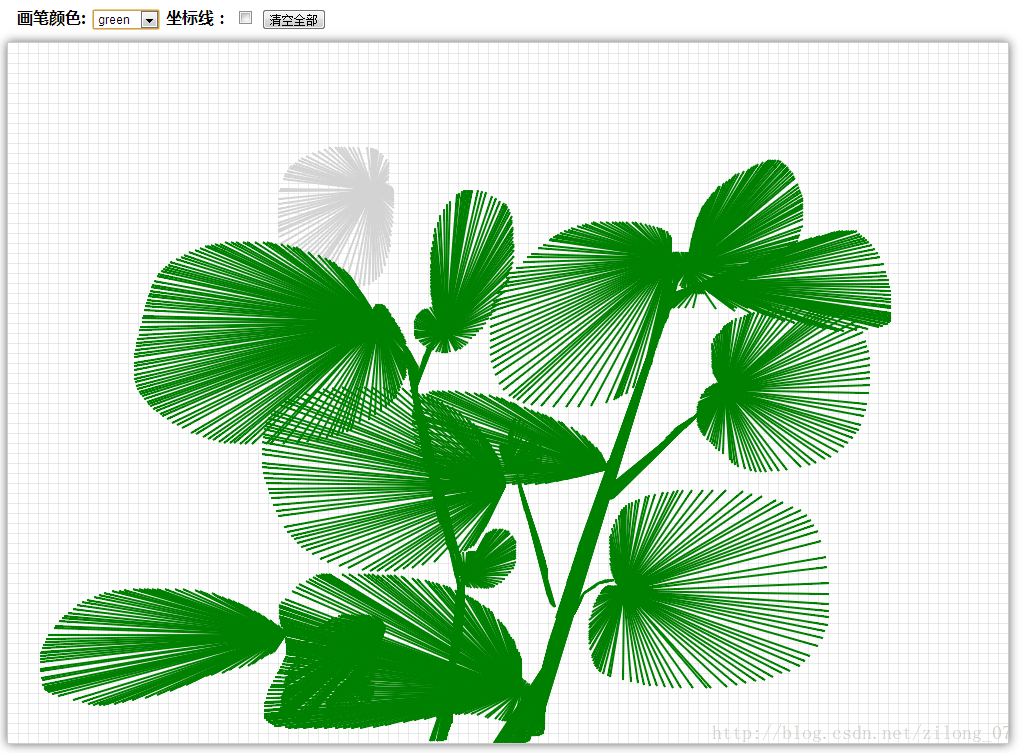
例子来源于《HTML5 Canvas核心技术-图形、动画与游戏开发》第2章的程序2-16.这个程序里为canvas对象注册onmousemove事件处理函数时,先使用context.putImageData()函数载入鼠标按下之前的图像数据,然后再绘制线条。
我做了这样的改动:每当鼠标移动时,实时绘制鼠标指针的轨迹点到按下鼠标的点之间的每条线段。这样会变得比较有趣:可以画出放射状的图案,哈哈。如下图所示。
代码如下:
我做了这样的改动:每当鼠标移动时,实时绘制鼠标指针的轨迹点到按下鼠标的点之间的每条线段。这样会变得比较有趣:可以画出放射状的图案,哈哈。如下图所示。
代码如下:
<!DOCTYPE HTML PUBLIC "-//W3C//DTD HTML 4.01 Transitional//EN">
<html>
<head>
<meta charset="UTF-8">
<title>Canvas画图</title>
<script src="http://ajax.googleapis.com/ajax/libs/jquery/1.8.0/jquery.min.js"></script>
<script type="text/javascript">
$(function(){
drawGrid(context, 'lightgray', 10, 10);
context.strokeStyle = 'black';
});
</script>
<style type="text/css">
#canvas{
margin: 0 auto;
border: 1px solid #cccccc;
box-shadow: #666666 0 0 15px;
}
#controls{
font-size: 16px;
font-weight: bold;
margin: 10px;
}
</style>
</head>
<body>
<div id="controls">
画笔颜色:
<select id="strokeStyleSelect">
<option value="red">red</option>
<option value="green">green</option>
<option value="blue">blue</option>
<option value="orange">orange</option>
</select>
坐标线:
<input type="checkbox" id="guidewireCheckbox" checked/>
<input type="button" id="eraseAllButton" value="清空全部">
</div>
<canvas id="canvas" width="1000px" height="700px"></canvas>
<p id="expireTime"></p>
<p id="callee_demo"></p>
</html>
<script type="text/javascript">
var canvas = document.getElementById('canvas');
var context = canvas.getContext('2d');

function drawGrid(context, color, stepx,stepy){
context.strokeStyle=color;
context.lineWidth = 0.5;

for(var i= stepx +0.5;i<context.canvas.width;i+=stepx){
context.beginPath();
context.moveTo(i,0);
context.lineTo(i,context.canvas.height);
context.stroke();
}
for(i= stepy +0.5;i<context.canvas.height;i+=stepy){
context.beginPath();
context.moveTo(0,i);
context.lineTo(context.canvas.width,i);
context.stroke();
}
}

// 橡皮筋画图模块
var eraseAllButton = document.getElementById('eraseAllButton'),
strokeStyleSelect = document.getElementById('strokeStyleSelect'),
guidewireCheckbox = document.getElementById('guidewireCheckbox'),
drawingSurfaceImageData,
mousedown = {},
rubberbandRect = {},
dragging = false,
guidewires = guidewireCheckbox.checked;

function windowToCanvas(x, y){
var bbox = canvas.getBoundingClientRect();
return {
x: x - bbox.left * (canvas.width/bbox.width),
y: y - bbox.top  * (canvas.width/bbox.width)
};
}

function saveDrawingSurface(){
drawingSurfaceImageData = context.getImageData(0, 0, canvas.width, canvas.height);
}

function restoreDrawingSurface(){
context.putImageData(drawingSurfaceImageData, 0 ,0);
}

// loc 是基于屏幕坐标系下的鼠标指针当前坐标
function updataRubberbandRect(loc){
rubberbandRect.width  = Math.abs(loc.x - mousedown.x);
rubberbandRect.height = Math.abs(loc.y - mousedown.y);

if(loc.x>mousedown.x){
rubberbandRect.left = mousedown.x;
}
else{
rubberbandRect.left = loc.x;
}

if(loc.y>mousedown.y){
rubberbandRect.top = mousedown.y;
}
else{
rubberbandRect.top = loc.y;
}
}

function drawRubberbandShape(loc){
context.beginPath();
context.lineWidth = 2.0;
context.moveTo(mousedown.x, mousedown.y);
context.lineTo(loc.x, loc.y);
context.stroke();
}

function updateRubberband(loc){
updataRubberbandRect(loc);
drawRubberbandShape(loc);
}

function drawHline(y){
context.beginPath();
context.moveTo(0, y+0.5);
context.lineTo(canvas.width, y+0.5);
context.stroke();
}

function drawVLine(x){
context.beginPath();
context.moveTo(x+0.5, 0);
context.lineTo(x+0.5, canvas.height );
context.stroke();
}

function drawGuidewires(x,y){
context.save();
context.strokeStyle = 'rgba(0,0,230,0.4)';
context.lineWidth = 1.0;
drawVLine(x);
drawHline(y);
context.restore();
}

canvas.onmousedown = function(e){
var loc = windowToCanvas(e.clientX, e.clientY);
e.preventDefault();
//saveDrawingSurface();
mousedown.x = loc.x;
mousedown.y = loc.y;
dragging = true;
};

canvas.onmousemove = function(e){
var loc;
if (dragging) {
e.preventDefault();
loc = windowToCanvas(e.clientX, e.clientY);
//restoreDrawingSurface();
updateRubberband(loc);
if (guidewires) {
drawGuidewires(loc.x, loc.y);
}
}
};

canvas.onmouseup = function(e){
var loc = windowToCanvas(e.clientX, e.clientY);
//restoreDrawingSurface();
updateRubberband(loc);
dragging = false;
};

eraseAllButton.onclick = function(e){
context.clearRect(0, 0, canvas.width, canvas.height);
drawGrid(context, 'lightgray', 10, 10);
saveDrawingSurface();
};

strokeStyleSelect.onchange = function(e){
context.strokeStyle = strokeStyleSelect.value;
};

guidewireCheckbox.onchange = function(e){
guidewires = guidewireCheckbox.checked;
};
</script>

相关文章推荐
- 一个不错的HTML5 Canvas多层点击事件监听实例
- 一个不错的HTML5 Canvas多层点击事件监听实例
- <html5 canvas>一个简单的矩形,clearRect(), strokeRect(), fillRect(), 鼠标事件onmousedown
- HTML5教程实例-用Canvas标签绘制圆形
- 实例讲解利用HTML5 Canvas API操作图形旋转的方法
- HTML5 Canvas锯齿图代码实例
- html5<canvas图像合成实例之随机闪烁的星星>
- 在网页上画一个矩形(HTML5 Canvas作图)
- 一个有趣的html5播放器
- HTML5 canvas标签绘制正三角形 鼠标按下点为中间点,鼠标抬起点为其中一个顶点
- HTML5_canvas(设置画笔样式、左右跑动的小块、绘制路径的方法、写字板、绘制圆形的方法、吃豆豆、绘制文本、环形进度条)设置一个模板
- HTML5快速入门实例(二)使用Canvas绘制文本
- HTML5 canvas 9绘制图片实例详解
- 分享一个超酷的开源html5 canvas互动网络图形效果javascript类库 - sig...
- [Web Chart系列之一(续)]Web端图形绘制SVG,VML, HTML5 Canvas 简单实例
- 使用HTML5 Canvas绘制一个太极,并令其转动
- HTML5 Canvas+JS控制电脑或手机上的摄像头实例
- 用html5 Canvas制作一个简单的游戏 英雄抓小怪物(上)
- html5 canvas绘制圆形进度实例
- 深度剖析IE10对HTML5 Canvas支持及实例教程(一)